Business Intelligence and Reporting
Many systems include some level of data visualizations and predictive analytics, albeit rudimentary ones. However, two stand apart for their ability to easily integrate into many small and mid-sized company ERP systems.

Many of Emerald TC’s customers use DataSelf or Velixo to visualize data and analyze business processes. We work with you to choose the best business intelligence solution for your company and ERP, and we walk through the implementation process with you to ensure your data flows smoothly.
DataSelf
DataSelf offers powerful data visualizations. Over 5,000 reports are available “out of the box,” and users can customize any of these reports to suit their needs. The easy and intuitive interface requires only a short learning period, and users can expect to reap substantial benefits very quickly.
DataSelf simplifies and amplifies BI with Tableau and Microsoft BI technologies by adding its own technology that eliminates programming and providing BI expertise and comprehensive out-of-the-box solutions.
Works With: Acumatica, Sage 100
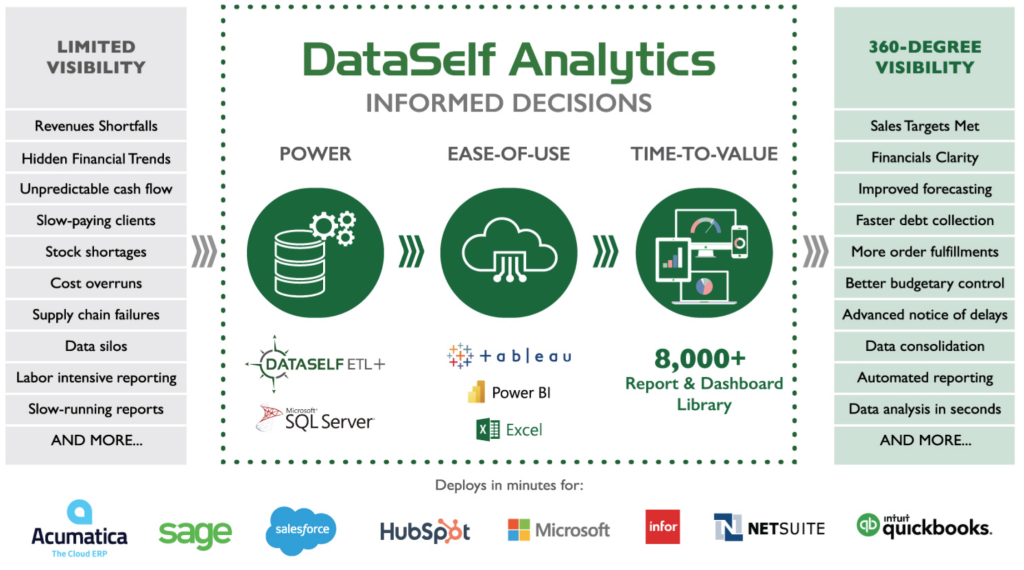
DataSelf brings power in the form of ETL+ and MS SQL Server to quickly and easily extract, optimize, and load data from your business apps into the DataSelf reporting database.
DataSelf leverages Tableau, Power BI and/or MS Excel to provide unequaled ease-of-use by automating the processes of connecting them with your underlying data sets and giving the BI engines secure access to highly-optimized application data. The report run-time (typically less than 10 seconds) & distribution process is also automated.
DataSelf’s award-winning library of over 8,000 (industry & role-specific) reports and dashboards provides the industry’s best time-to-value proposition, enabling decision-makers with the right information at the right time.
The effort to deploy and maintain DataSelf is dramatically reduced compared to competing solutions.

Benefits
The following are examples of reporting and data analysis areas that organizations improve by leveraging DataSelf Analytics anytime and anywhere via any device.
- Sales targets met by closely and timely monitoring sales initiatives (current, historical, and projections) and comparing them to targets/forecasts.
- Faster debt collection by monitoring receivables trends and high-risk clients.
- More order fulfillment by monitoring sales demand and forecast, inventory on hand, reasons why some orders are not fulfilled, and supply chain challenges.
- Advanced notice of delays with drill-down into specific items and/or vendors, enabling you to anticipate and plan for interruptions in your supply chain.
- Better budgetary control by consolidating sales, cost-of-goods sold, and gross profit—showing actual-versus-budget (& variance) figures for any selected time range.
- Improved forecasting such as sales forecast, inventory planning, cash flow projection, budgeting, financials (P&L and B/S), supply chain, manufacturing, and project deliverables.
- Data consolidation using DataSelf’s next-generation ETL+ technology to securely extract, store and optimize your organization’s data (single or multiple data silos), and then leverage MS SQL, Tableau, Power BI, and/or MS Excel to give the right data to the right person at the right time.
- Data analysis in seconds using highly-optimized data from your applications, enabling most reports to run in under 10 seconds.
- Automated reporting to ensure that your staff, clients, and partners automatically receive the precise reports and dashboards they need when they need it. Mechanical and repetitive reporting tasks become automated.
- Highly customizable dashboards give you a nearly endless number of ways to slice and dice data.
- And more … including Natural Language Query (NLQ), a Google-like interface that instantly turns plain English report requests into the reports & dashboards you need.
Velixo
Velixo offers intuitive, out-of-the-box functionality. The program connects to Excel, bringing your ERP data into Excel and offering 50 functions to transform the data into valuable reports. It’s a great time saver for companies seeking a faster and more cost-effective way to harness data for better decision making. Within Velixo, data is loaded and refreshed in a matter of seconds for a lightning-fast display. There is zero learning curve for users, because if you know how to use Excel, you know how to use Velixo!
Works With: Acumatica, Sage 100
Benefits
Bring Your ERP and Your Excel Worlds Together
Our simple, manageable solution gives you real-time access to your ERP data as well as tools that facilitate reporting, planning, data management, and business process automation—all from the comfort of a Microsoft Excel spreadsheet.
Connect using your ERP login credentials and start building Excel spreadsheets that instantly include ERP data. Velixo Reports adds a ribbon to Excel and more than 80 functions that are specially designed to work with your ERP system.
View Live Results While Building Reports
You’re always working with the most up-to-date data. Changes you make to formulas and cells are reflected immediately in your spreadsheet. Easily update the cell to see the P&L of another branch or run it for a different financial period.
Save Days of Work with Smart Refresh
No more exports or manual entries required. Velixo Reports always gives you up-to-date information. Thanks to Smart Refresh, new data is updated quickly, allowing you to refresh even the most complex report in just a few seconds.
Build Any Type of Report
Any spreadsheet that requires ERP data will benefit from Velixo Reports. Cash flow statements, sales dashboards, budgets, allocation and accrual calculations, intercompany sales eliminations, and project progress reports are just some examples of what our customers have created with Velixo Reports. Charts, graphics and KPIs can also be incorporated easily into any spreadsheet.
Automatically Share Reports
Automatically email, export, or share multiple versions of the same report with a single click. Report distribution is customizable so you can include different tabs or set specific parameters based on who’s going to receive it. Easily output reports as Excel sheets, PDFs or Values. For more security, we’ve added the option to password protect the files.
Work with GL & Budget Writebacks
Create and post GL entries without leaving Excel. The content and amounts of the GL entry can be dynamic and based on Excel formulas. Moreover, you can retrieve multiple budgets and forecasts and report them in Excel. Simply adjust the number or apply your own budget model and write back the modified budget to your ERP.
Get to the Bottom of Everything with Smart Drilldown
Right-click on any cell and get detailed insight into the data referenced in a calculation. You can drill all the way down to the original document in your ERP and review any note, activity or file attached to it. Smart Drilldown lets you analyze formula cells that reference other cells, such as a Gross Profit or Net Income calculation, and will even show you where the Velixo Reports functions were found.
Consolidate Data from Multiple Sources
Multiple companies, multiple tenants, public cloud, private cloud or on-premise installations—Velixo Reports can consolidate your data in a single Excel spreadsheet while maintaining full history. If you can access it from your web browser, Velixo Reports can connect to it.
Secure Your Access
Use the same login and password that you use when connecting to your ERP from a web browser. You can restrict access to specific roles and users. Access rights and other restrictions allow you to control who has access to what.
Include Unlimited Excel Users
Grant access to anyone who needs it, at no extra charge. Give your whole workforce the benefit of up-to-date information.
Manufacturing Software Solutions for Industry 4.0
By now, you’ve probably heard of the term Industry 4.0 and the many manufacturing software…
The Future of Business Budgeting, Planning, and Forecasting
CFOs responsible for businesses budgeting, including planning and forecasting, have always embraced change when it…
Five Business Intelligence Benefits
There are many business intelligence benefits, but most companies aren’t aware of the power of…


